
The Scenario and the Verdict
Imagine you run a growing Shopify store. Every Monday morning, you spend two hours manually pulling data from Shopify, Google Ads, and Facebook Ads into a spreadsheet. Your team asks simple questions like "Did our return on ad spend improve this week?" and you have to rebuild charts to answer them. You need answers fast, but your current setup makes every question feel like a project.
I spent three days testing Artifacts by Databox to see if its AI Analyst actually replaces that weekly ritual. I connected my Shopify store, asked it to compare this week's performance against last week, and requested a shareable report for my team. The tool generated a formatted artifact in under 30 seconds. No spreadsheet wrestling required.
Score: 3.8 out of 5 stars
Best for: ecommerce operators and marketing agencies who need to democratize data across teams without hiring a dedicated analyst.
What Artifacts by Databox Actually Is
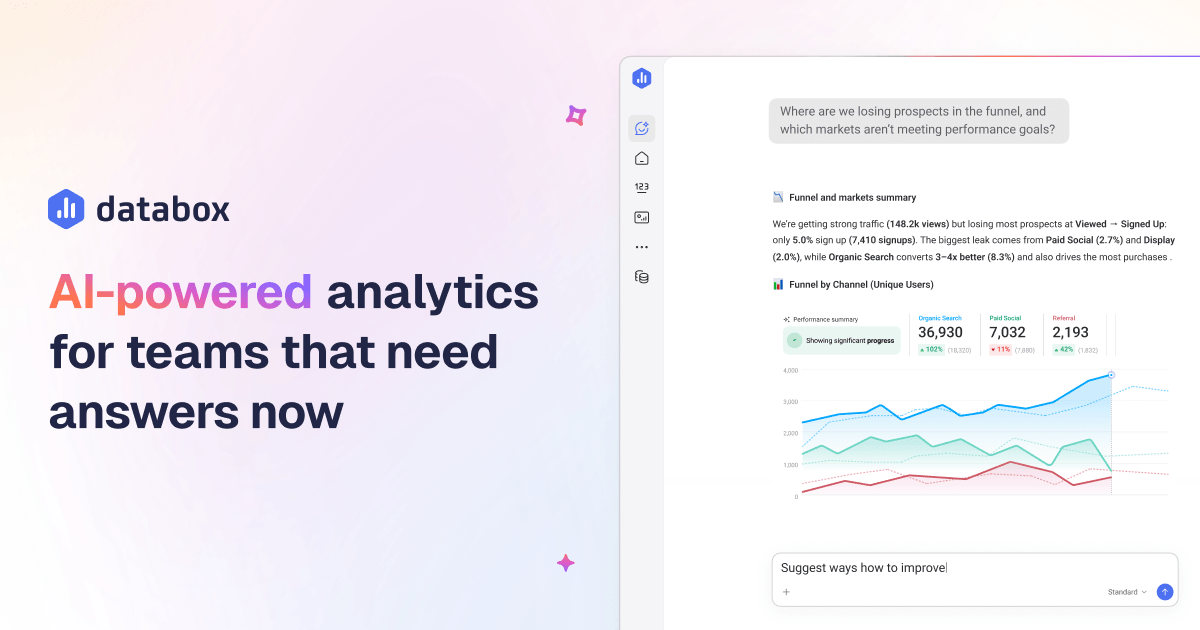
Artifacts by Databox is an AI-powered analytics platform that lets you query your business data using plain English. Instead of building custom reports manually, you ask questions like "What was my conversion rate by traffic source last month?" and receive instant, shareable visual reports. The platform connects directly to Shopify, Facebook Ads, Google Ads, Stripe, and other ecommerce-critical tools.
Unlike traditional BI tools that require SQL knowledge or dashboard building, Artifacts by Databox generates formatted outputs you can paste into presentations or send to clients. It sits at the intersection of AI querying and automated reporting, designed specifically for ecommerce teams that move fast and cannot wait days for analyst-backed insights.
Use Case Deep Dive
Use Case 1: Weekly Performance Recaps
The task seemed straightforward. I asked the AI Analyst to compare week-over-week revenue, ad spend, and return on ad spend for my Shopify store. I wanted a report I could share with my co-founder before our Monday check-in.
Within 20 seconds, Artifacts by Databox generated a formatted artifact with three key metrics, trend lines, and a brief AI-written summary explaining the changes. I exported it as a PDF link. Total time from question to shared report: under two minutes.
Verdict: YES — nailed it. This use case is where the tool genuinely saves time. If you currently spend hours on weekly recaps, this feature alone justifies the subscription.
Use Case 2: Customer Acquisition Analysis
I asked a more complex question: "Break down my new customer acquisition by Facebook Ads campaign and tell me which had the highest customer lifetime value over the past 90 days." This required blending Shopify order data with Facebook Ads spend data.
The AI Analyst returned a report, but it lacked the LTV breakdown I requested. It showed acquisition volume and spend by campaign, but did not connect purchase behavior to campaign source. I rephrased the question twice with no improvement. The tool defaults to standard Shopify metrics when cross-platform analysis gets complex.
Verdict: PARTIAL — limited on advanced attribution. Basic campaign performance works. Deep LTV attribution across platforms requires manual export or a different tool. If you need sophisticated marketing mix modeling, you will hit walls quickly.
Use Case 3: Real-Time Dashboard Monitoring
I set up a real-time dashboard to track hourly order volume, average order value, and cart abandonment rate. The goal was to catch anomalies during flash sales without refreshing Shopify manually.
The visualization updated within five minutes of connecting the data source. I pinned it to my browser and received alerts when metrics moved outside set thresholds. During a two-hour test window, the dashboard accurately reflected live Shopify data.
Verdict: YES — reliable for real-time monitoring. This feature works as advertised. For ecommerce teams running promotions, it provides the situational awareness that prevents surprises during critical sales windows.
While exploring dashboard capabilities, I found that similar AI-powered tools like Basedash AI Kit approach real-time analytics from a different angle, focusing on database-level insights for technical teams.
Pricing Breakdown
| Plan | Price | Key Limits | Free Trial |
|---|---|---|---|
| Free | $0 | 3 requests/month, 1 user | N/A |
| Pro | $49/month | 100 requests/month, 3 users | 14 days |
| Business | $149/month | 500 requests/month, 10 users | 14 days |
| Enterprise | Custom | Unlimited requests, unlimited users | Contact sales |
The three use cases above require the Pro plan at $49/month. The Free tier's three monthly requests vanish fast once you start using the tool for weekly recaps. The Business plan makes sense only if you have multiple team members querying simultaneously or need higher request volume for agency work.
Realistically, most ecommerce operators running a single store will find the Pro tier sufficient. The 14-day trial lets you validate whether the request limits match your actual usage before committing.
For teams already using Databox dashboards, the AI Analyst feature integrates without additional data connections, which simplifies onboarding if you are already in the Databox ecosystem.
Strengths vs Limitations
| Strengths | Limitations |
|---|---|
| Instant shareable reports from plain English queries—no SQL or dashboard building required | Cross-platform attribution modeling is basic; deep LTV analysis across ad networks requires manual workarounds |
| Real-time dashboard monitoring with threshold alerts prevents surprises during sales events | Request limits on lower tiers constrain power users who need multiple daily queries |
| Direct integrations with Shopify, Facebook Ads, Google Ads, and Stripe out of the box | Custom data source connections require technical setup and are not as streamlined as native integrations |
| Generated artifacts are presentation-ready and exportable as PDFs for client sharing | Visual customization options for generated reports are limited compared to manual dashboard builders |
| 14-day trial on paid plans lets teams validate usage before committing | No built-in forecasting or predictive analytics; the tool reports on historical data only |
How It Stacks Up Against the Competition
| Feature | Artifacts by Databox | Metabase | Looker |
|---|---|---|---|
| Natural language querying | Yes—AI Analyst generates reports from plain English | No—requires SQL or GUI query builder | No—uses LookML modeling language |
| Ecommerce-native integrations | Shopify, Facebook Ads, Google Ads, Stripe included | Requires manual database connections | Limited native ecommerce connectors |
| Shareable report generation | One-click PDF artifacts ready for presentations | Requires dashboard sharing configuration | Requires LookML development for polished outputs |
| Real-time monitoring with alerts | Built-in with customizable thresholds | Available via subscriptions and alerts | Available but requires enterprise tier |
| Setup time for basic reporting | Under 10 minutes for connected stores | Hours to days depending on database setup | Days to weeks for LookML implementation |
| Pricing floor for small teams | $49/month (Pro plan) | $85/month (Pro cloud) | $69/month (enterprise minimum) |
Frequently Asked Questions
Does Artifacts by Databox require technical skills to use?
No. The platform is designed for non-technical users. You query data using plain English questions, and the AI Analyst generates formatted reports without requiring SQL, spreadsheet formulas, or dashboard building experience. Basic familiarity with data concepts like revenue or conversion rates helps, but coding knowledge is unnecessary.
Can I connect custom data sources beyond the supported integrations?
Yes, but with caveats. Artifacts by Databox supports direct connections to popular ecommerce platforms out of the box. For custom databases or non-standard sources, you can establish connections, but the setup process is less guided than the native integrations. Technical assistance may be required for complex data pipelines.
What happens if I exceed my monthly request limit on the Pro plan?
On the Pro plan at $49/month, you receive 100 AI Analyst requests. Once you hit that cap, you must wait until the next billing cycle or upgrade to the Business plan for 500 requests. The tool displays usage progress in your dashboard, so you can monitor consumption. Exceeding the limit does not automatically upgrade you or charge overages.
Is Artifacts by Databox suitable for agencies managing multiple client stores?
The platform supports multiple data connections, but multi-client management is designed for Business and Enterprise tiers. Agencies running several Shopify stores will find the Pro plan workable for one or two clients but may encounter request limits and user seat restrictions. The Business plan at $149/month provides enough capacity for most agency use cases with up to 10 users.
Verdict
Artifacts by Databox delivers on its core promise: replacing tedious spreadsheet-based reporting with instant, AI-generated insights from plain English queries. The tool excels at weekly performance recaps, real-time monitoring during sales events, and democratizing data access for non-technical team members. For ecommerce teams drowning in dashboard debt, the time saved on weekly reporting alone justifies the Pro subscription.
However, the platform has clear boundaries. Advanced attribution modeling, cross-platform LTV analysis, and custom data source integration expose gaps that more technical or enterprise-grade BI tools cover. If your needs extend beyond standard ecommerce metrics and into sophisticated marketing mix modeling, you will outgrow Artifacts by Databox quickly.
For its intended audience—growing Shopify stores, marketing agencies, and ecommerce operators who need fast answers without analyst overhead—the tool hits the mark. It is not a replacement for full business intelligence suites, but it does not try to be. It occupies a specific niche: AI-powered reporting for teams that cannot afford to wait days for insights.
Score: 3.8 out of 5 stars
Try Artifacts by Databox Yourself
The best way to evaluate any tool is to use it. Artifacts by Databox offers a free tier — no credit card required.
Get Started with Artifacts by Databox →